Background and Tutorials
This document describes how to use a shotgun metagenomics workflow on Galaxy Australia. The aim of this workflow is to handle the routine part of shotgun metagenomics data processing. The workflow is using the tools MetaPhlAn2 for taxonomy classification and HUMAnN2 for functional profiling of the metagenomes.
The workflow is based on the Galaxy Training tutorial Analyses of metagenomics data.
Analysis overview
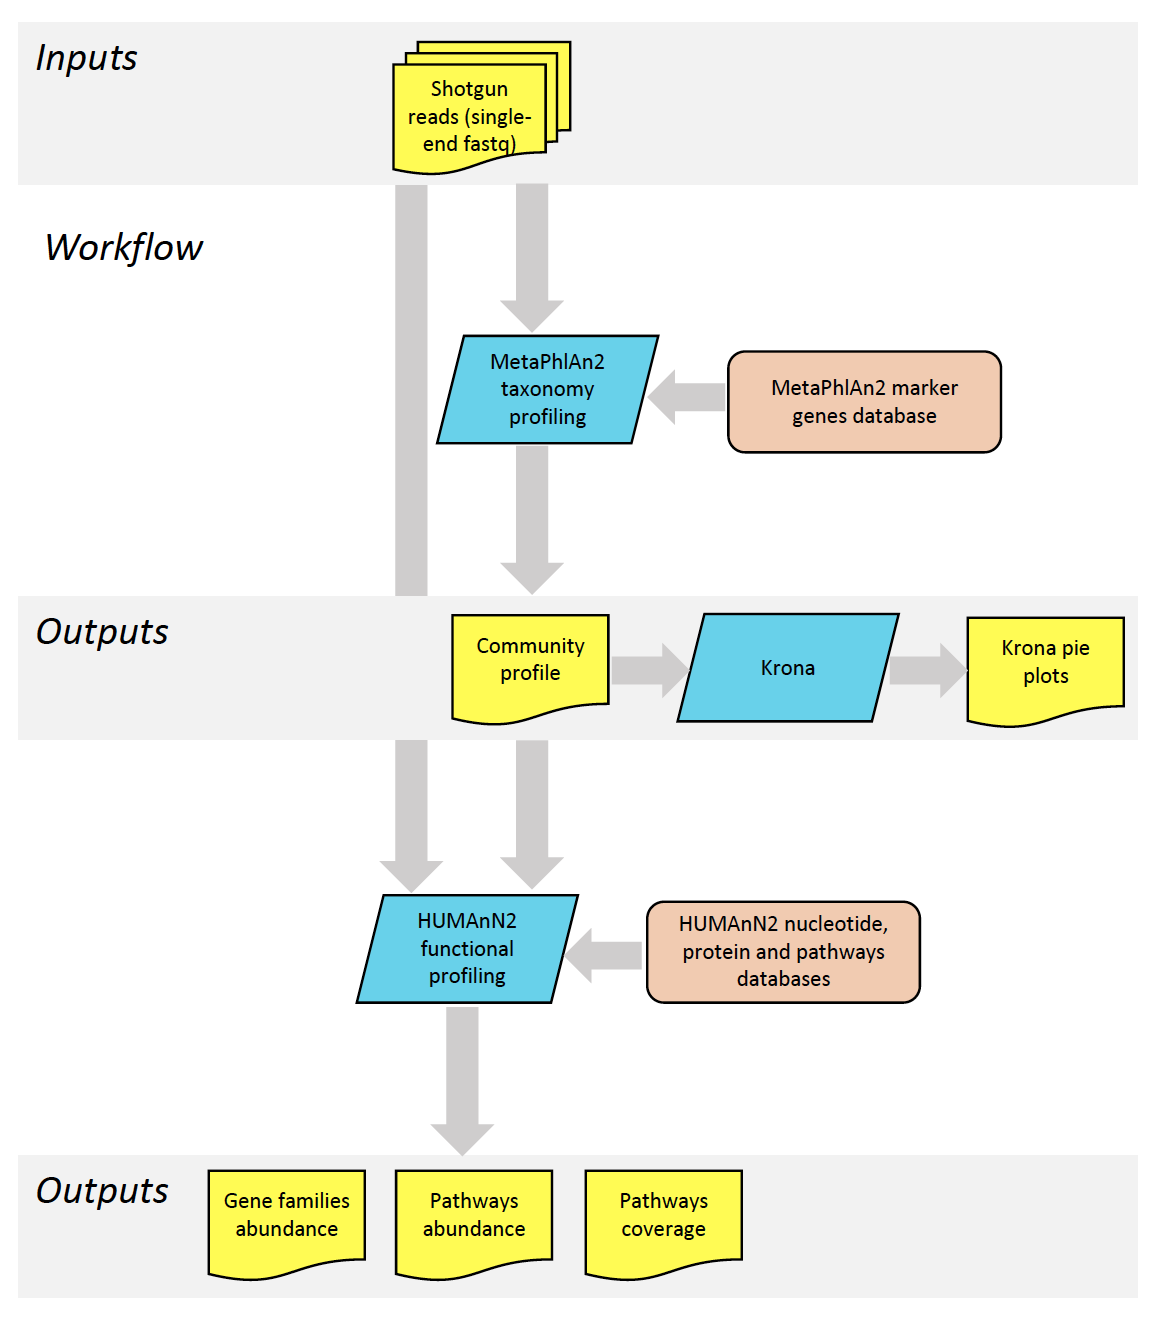
The diagram below represents an overview of the shotgun metagenomics pipeline, with the tools used (blue), the databases (orange), and the input and output data (yellow).
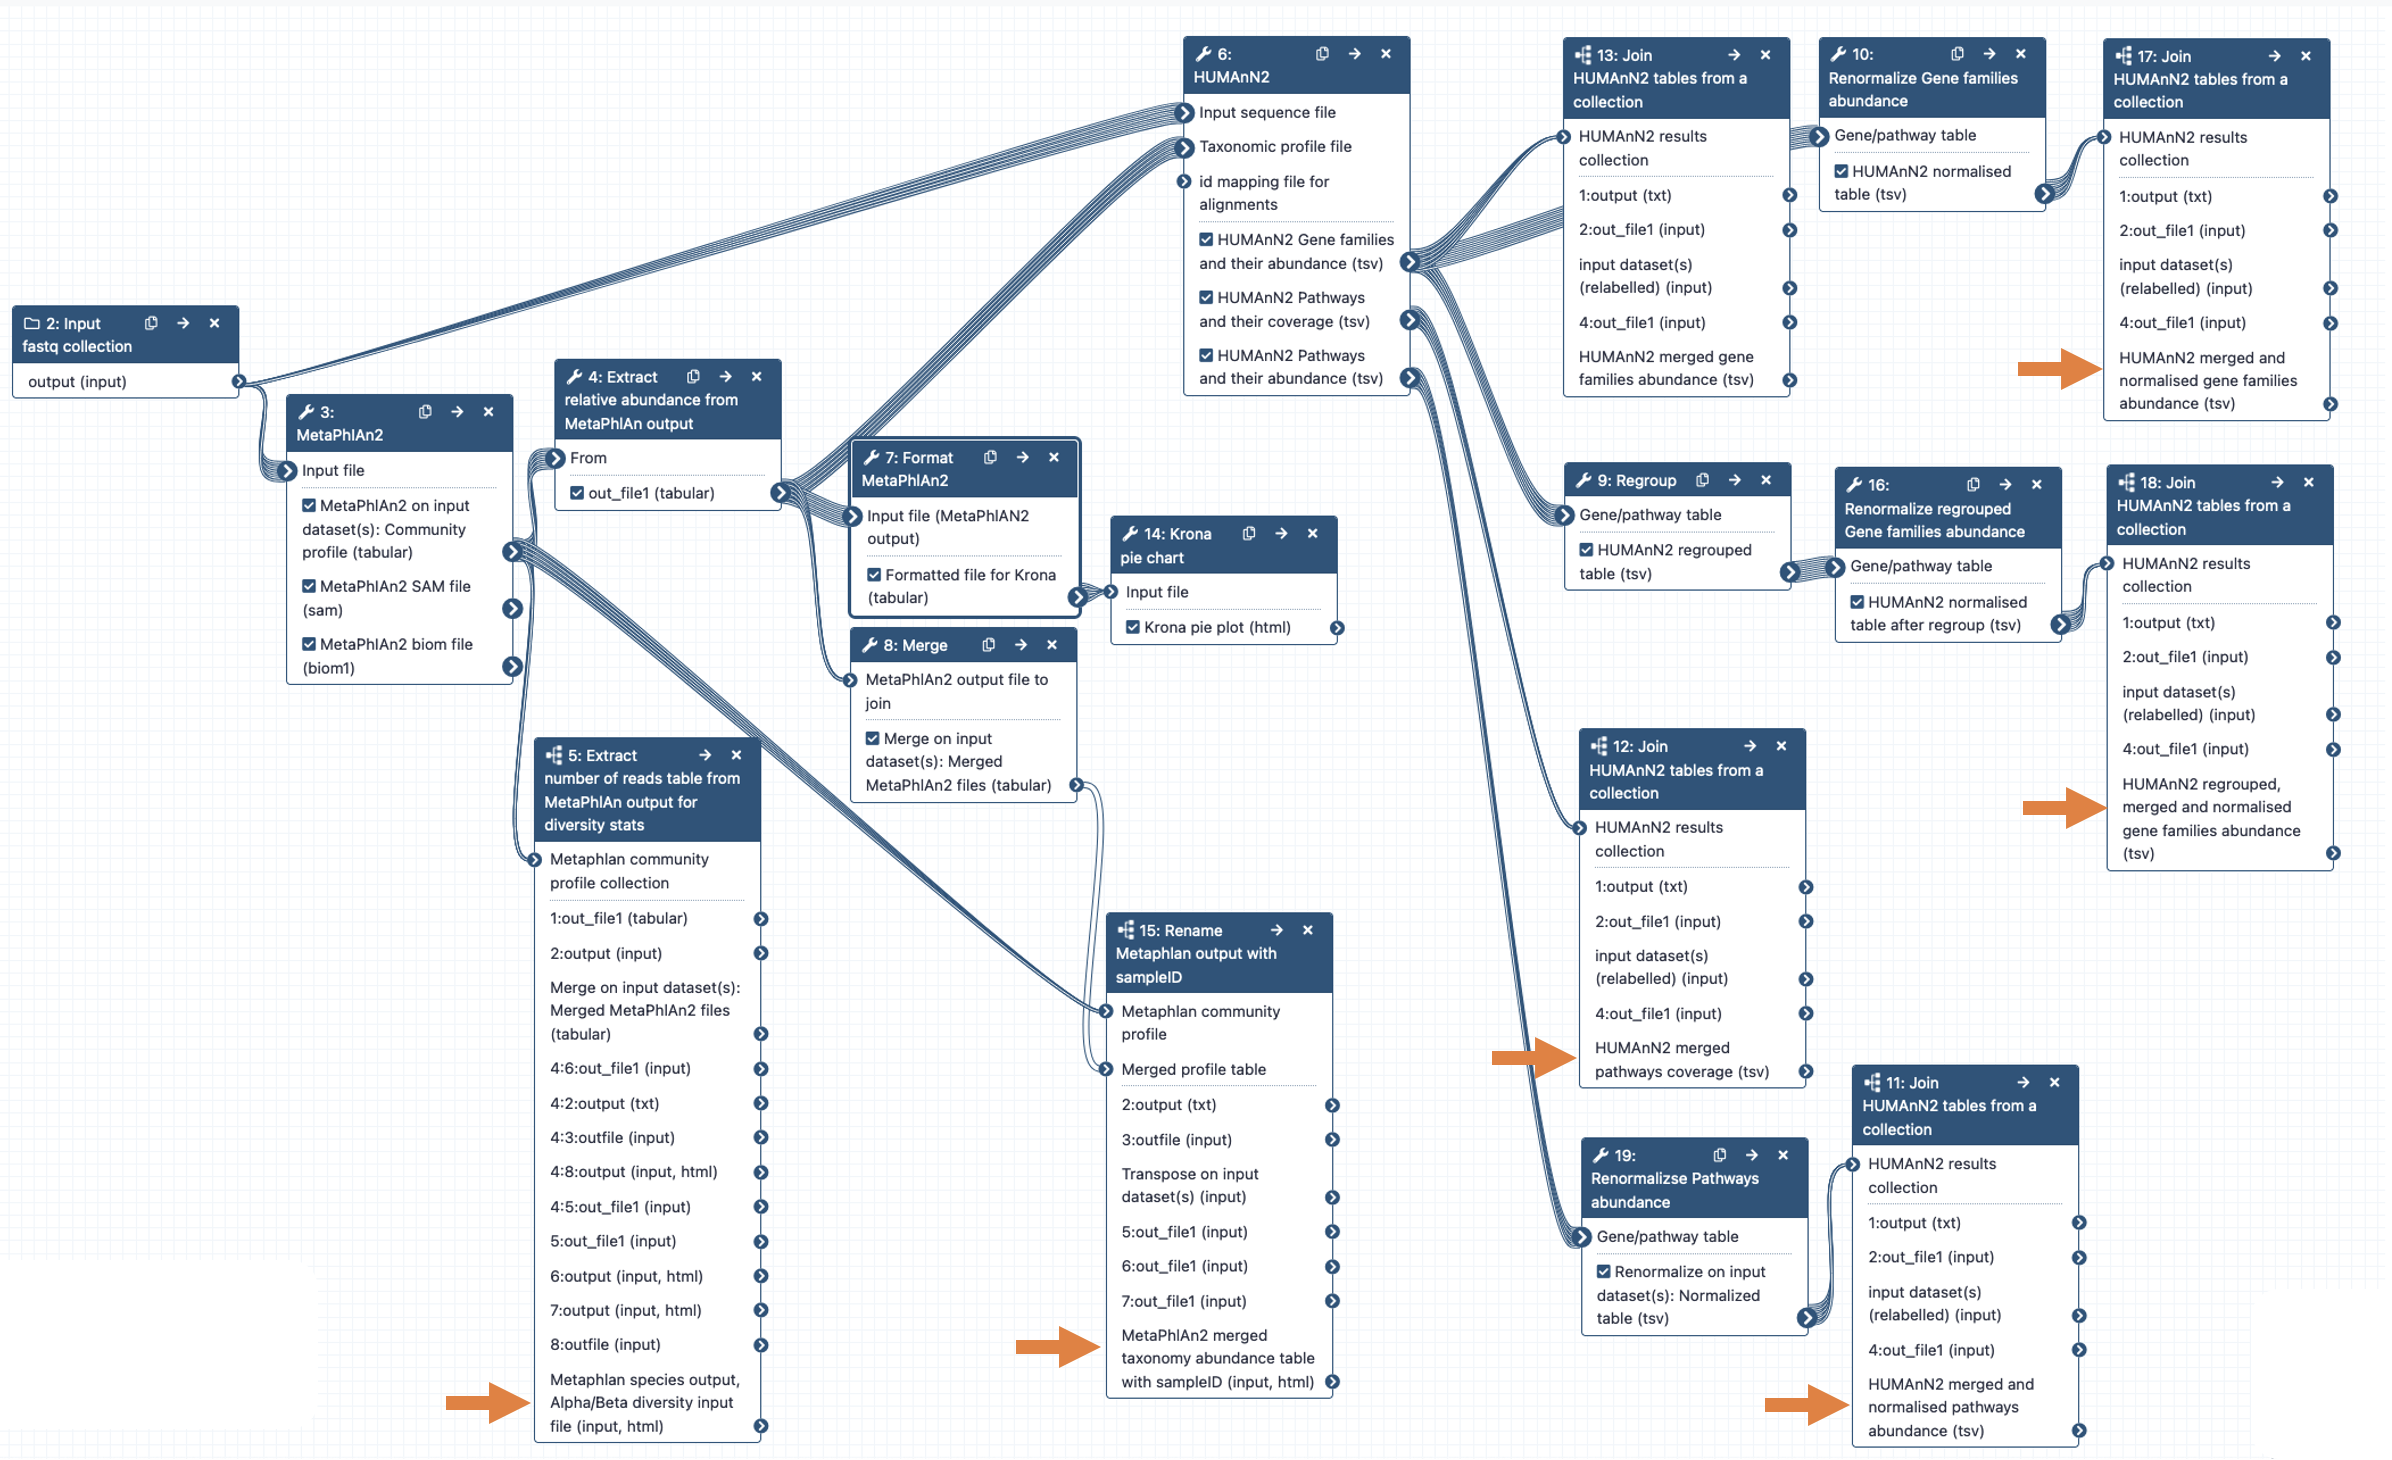
The different steps of the pipeline are representing in more details in the Galaxy workflow diagram below. The arrows in orange point to the main results files.
1. Extraction of taxonomic information (MetaPhlAn2)
Assignation of taxonomy on the whole sequences using databases with marker genes. MetaPhlAn2 is using a database of ~1M unique clade-specific marker genes (not only the rRNA genes) identified from ~17,000 reference (bacterial, archeal, viral and eukaryotic) genomes.
MetaPhlAn2 generates 3 files:
-
A tabular file with the community structure. Each line contains a taxa and its relative abundance found for our sample. The results are visualised with Krona plots.
-
A BIOM file with the same information as the previous file but in BIOM format
-
A SAM file with the results of the mapping of the sequences on the reference database
2. Extraction of functional information (HUMAnN2)
In the shotgun data, we have access to the gene sequences from the full genome. We use that to identify the genes, associate them with a function, build pathways, etc., to investigate the functional part of the community.
HUMAnN2 generates 3 files:
-
A file with the abundance of gene families. Gene family abundance is reported in RPK (reads per kilobase) units to normalize for gene length. It reflects the relative gene (or transcript) copy number in the community. The RPKs of reads that map to gene families that lack UniRef90 IDs are captured as UniRef90_unknown, and unmapped read abundances as UNMAPPED. The “UNMAPPED” value is the total number of reads which remain unmapped after both alignment steps (nucleotide and translated search). Since other gene features in the table are quantified in RPK units, “UNMAPPED” can be interpreted as a single unknown gene of length 1 kilobase recruiting all reads that failed to map to known sequences.
-
A file with the coverage of pathways. Pathway coverage provides an alternative description of the presence (1) and absence (0) of pathways in a community, independent of their quantitative abundance.
-
A file with the abundance of pathways
User guide
Running a multi sample experiment
1. Upload the raw datasets (fastq files) in a Galaxy history
2. Create a dataset collection containing the fastq files
The goal of a collection is to process all the samples at once.
The workflow will take one fastq file per sample as input.
- If the dataset are single-end reads, include all the files in the collection
- If the dataset are paired-end reads, only include the forward reads (R1) for each sample
Figure: Creating a collection
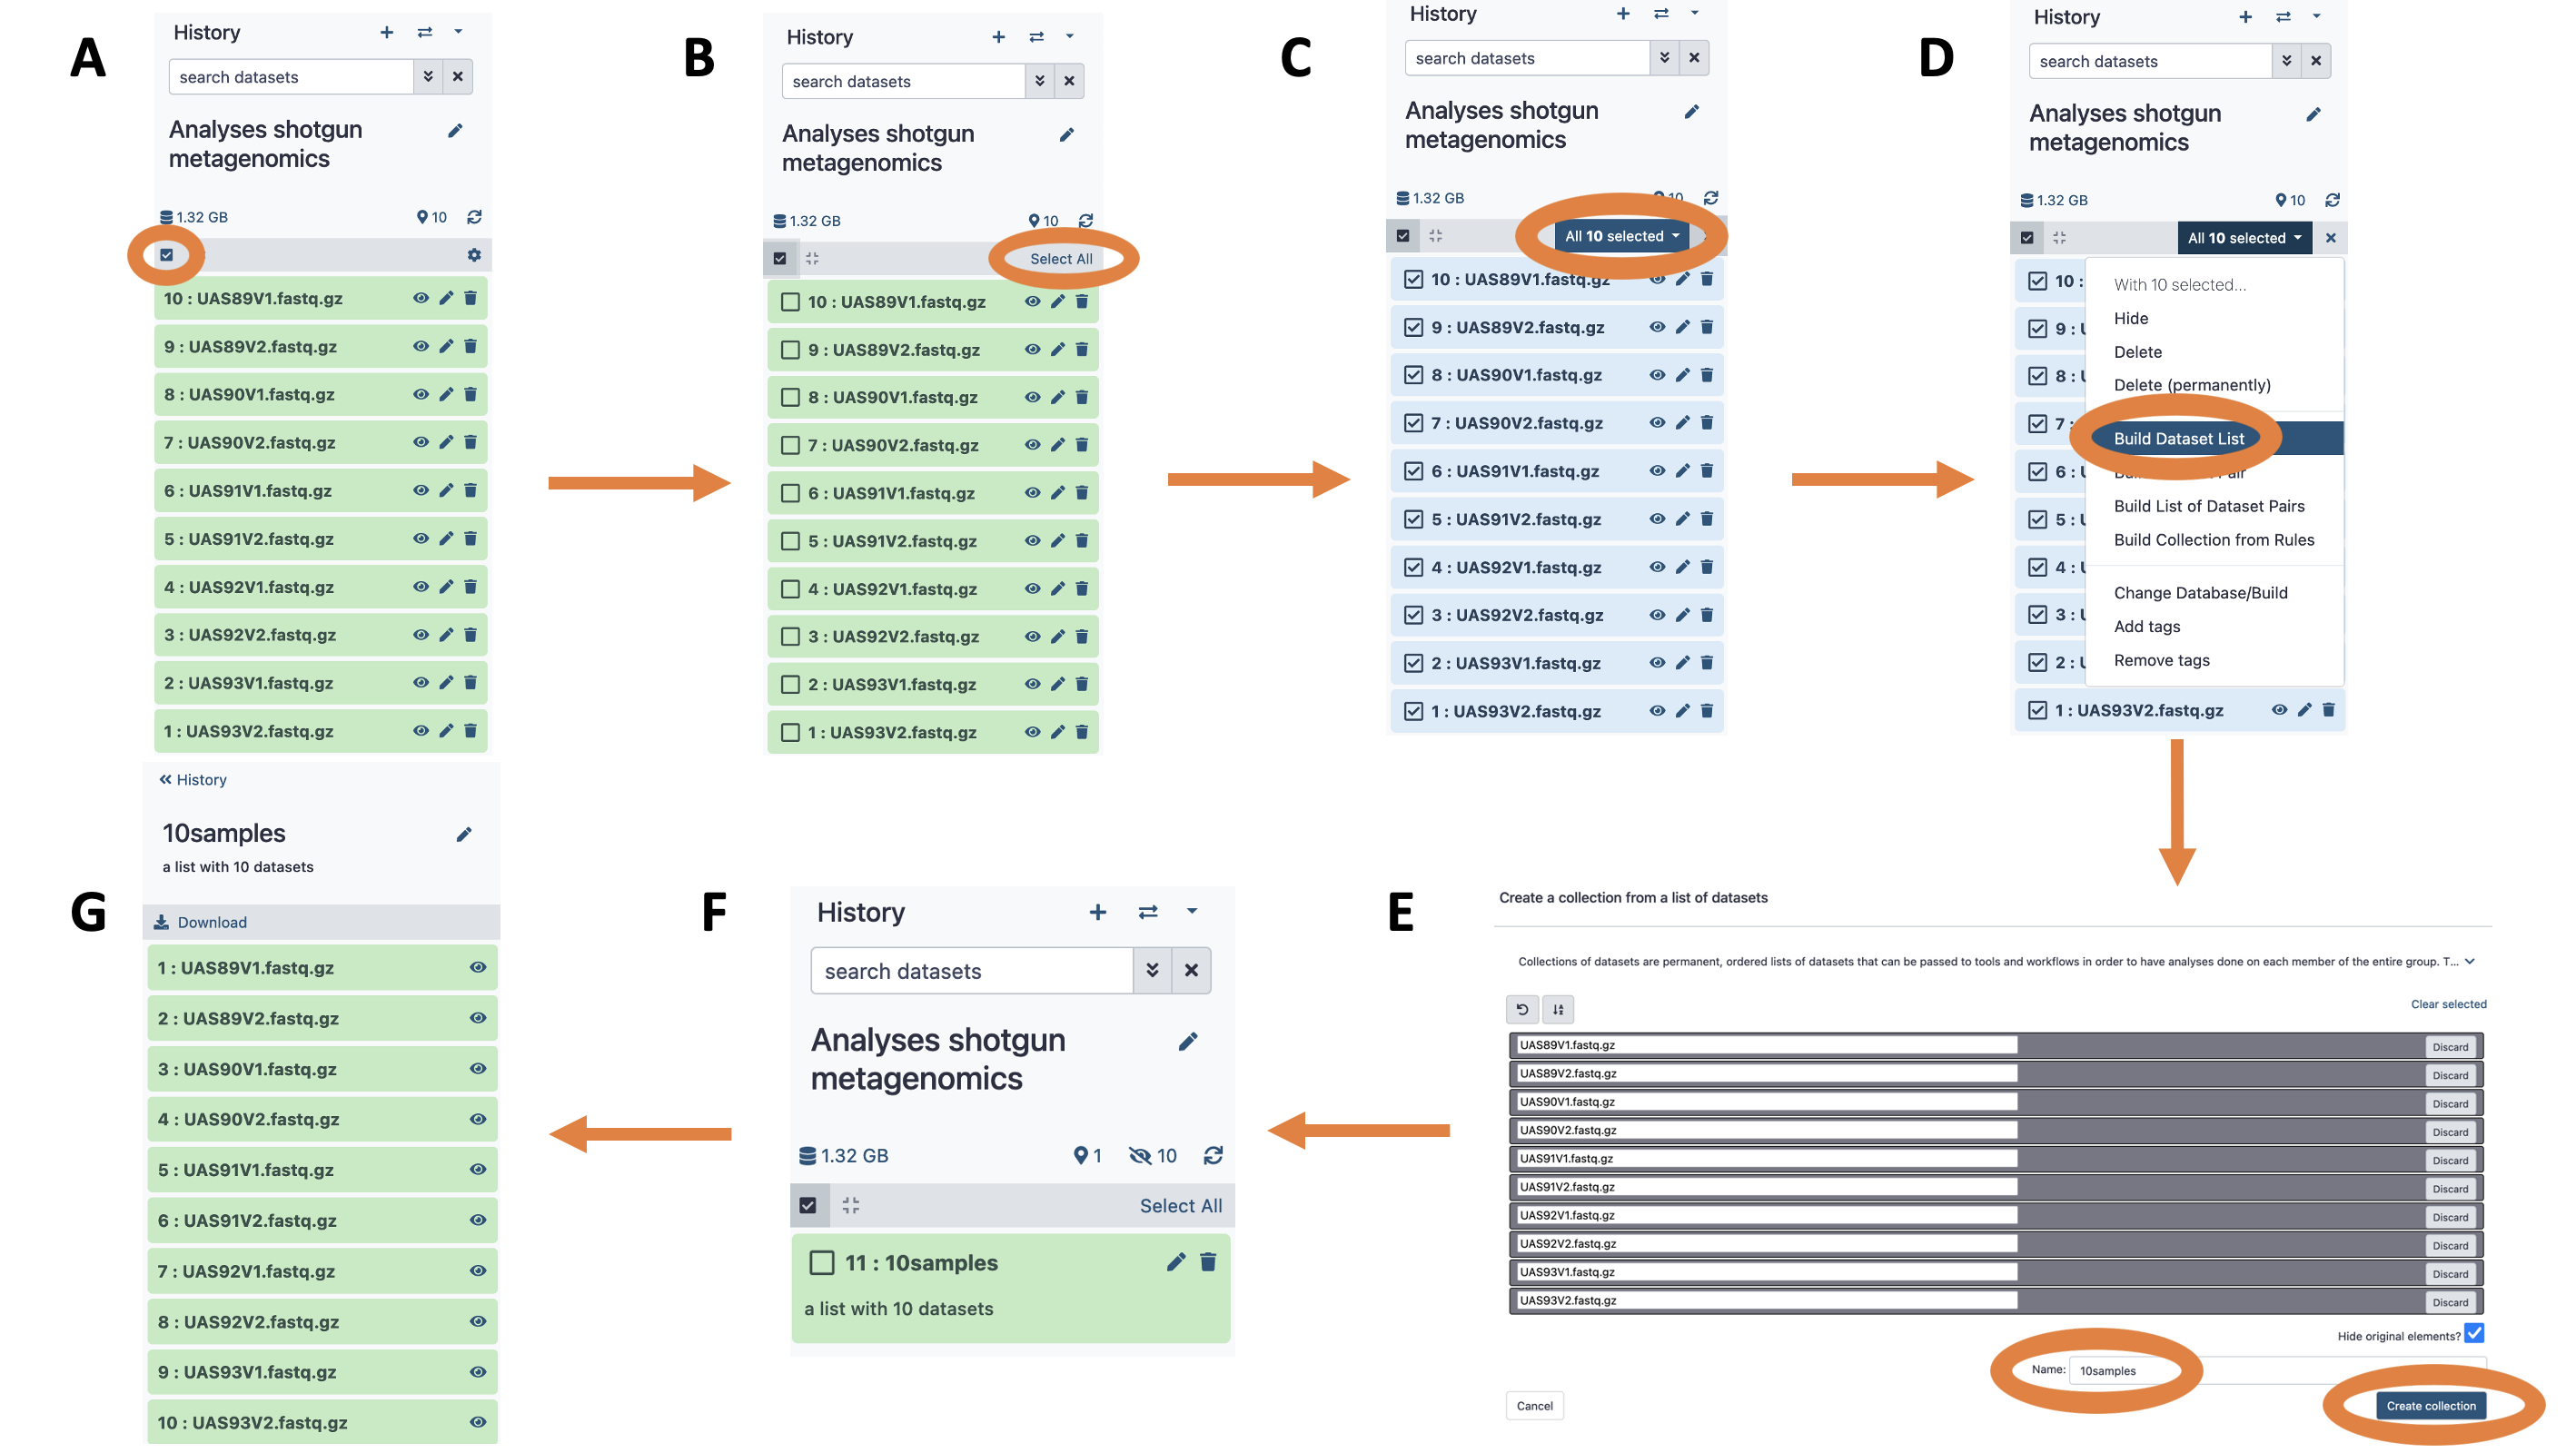
A. Click the checkbox icon. This will reveal checkboxes to the left of all datasets in the history.
B. In this case we want to select all datasets, so press “Select All” button (alternatively datasets can be filtered). This will put a check mark into all checkboxes.
C. Click “All 10 selected…” button. This will reveal a dropdown.
D. Since this is not paired-end (or mate-pair) data we will choose to “Build Dataset List”. This will open a dataset collection creator interface.
E. Within the dataset collection creator interface, use the “Name” box to name the collection. “Hide original elements” checkbox ensures that upon creating the collection the original datasets will be hidden from the history as shown in the next figure. Click “Create collection”.
F. A collection named “10 samples” is now added to the history and original datasets are hidden, so that the history only has one item.
G. Clicking on a collection reveals its content.
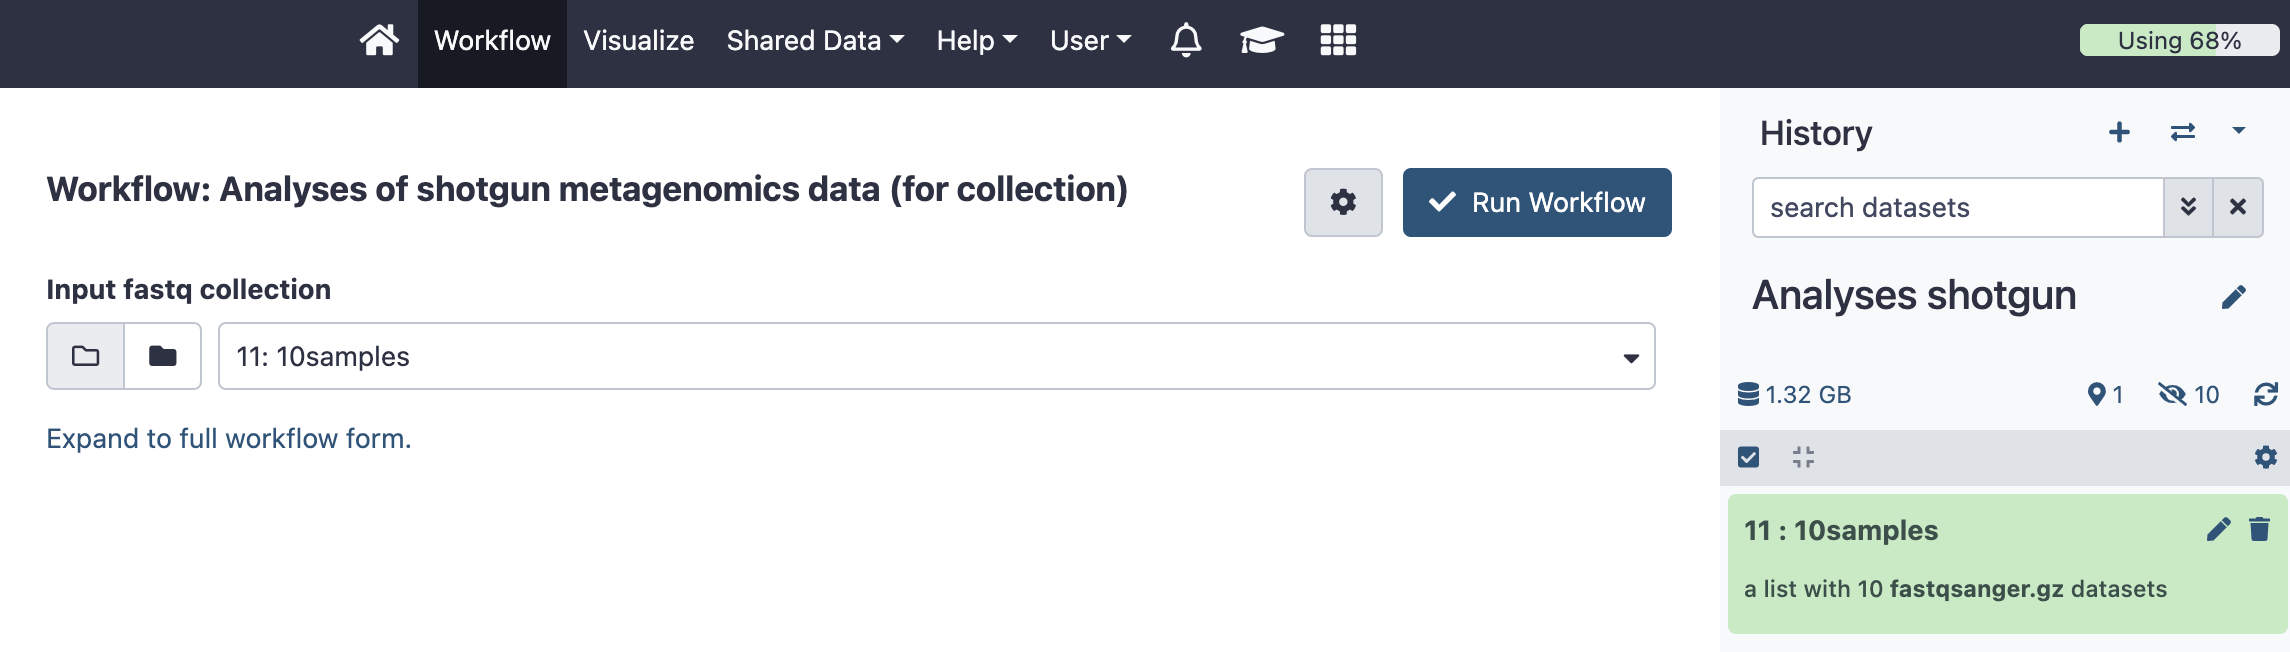
3. Run the shotgun workflow
A. Click on “Workflow” in the Galaxy horizontal menu
B. Search for the shotgun metagenomics workflow called “Analyses of shotgun metagenomics data with MetaPhlAn v2”. Link to the shotgun metagenomics workflow for collection
C. Click on “Run workflow” (white arrow on the right)
D. Select the “input fastq collection” to be the collection you just created (“10 samples”) from the currenty history.
E. Click on “Run Workflow”
Figure: Run the workflow

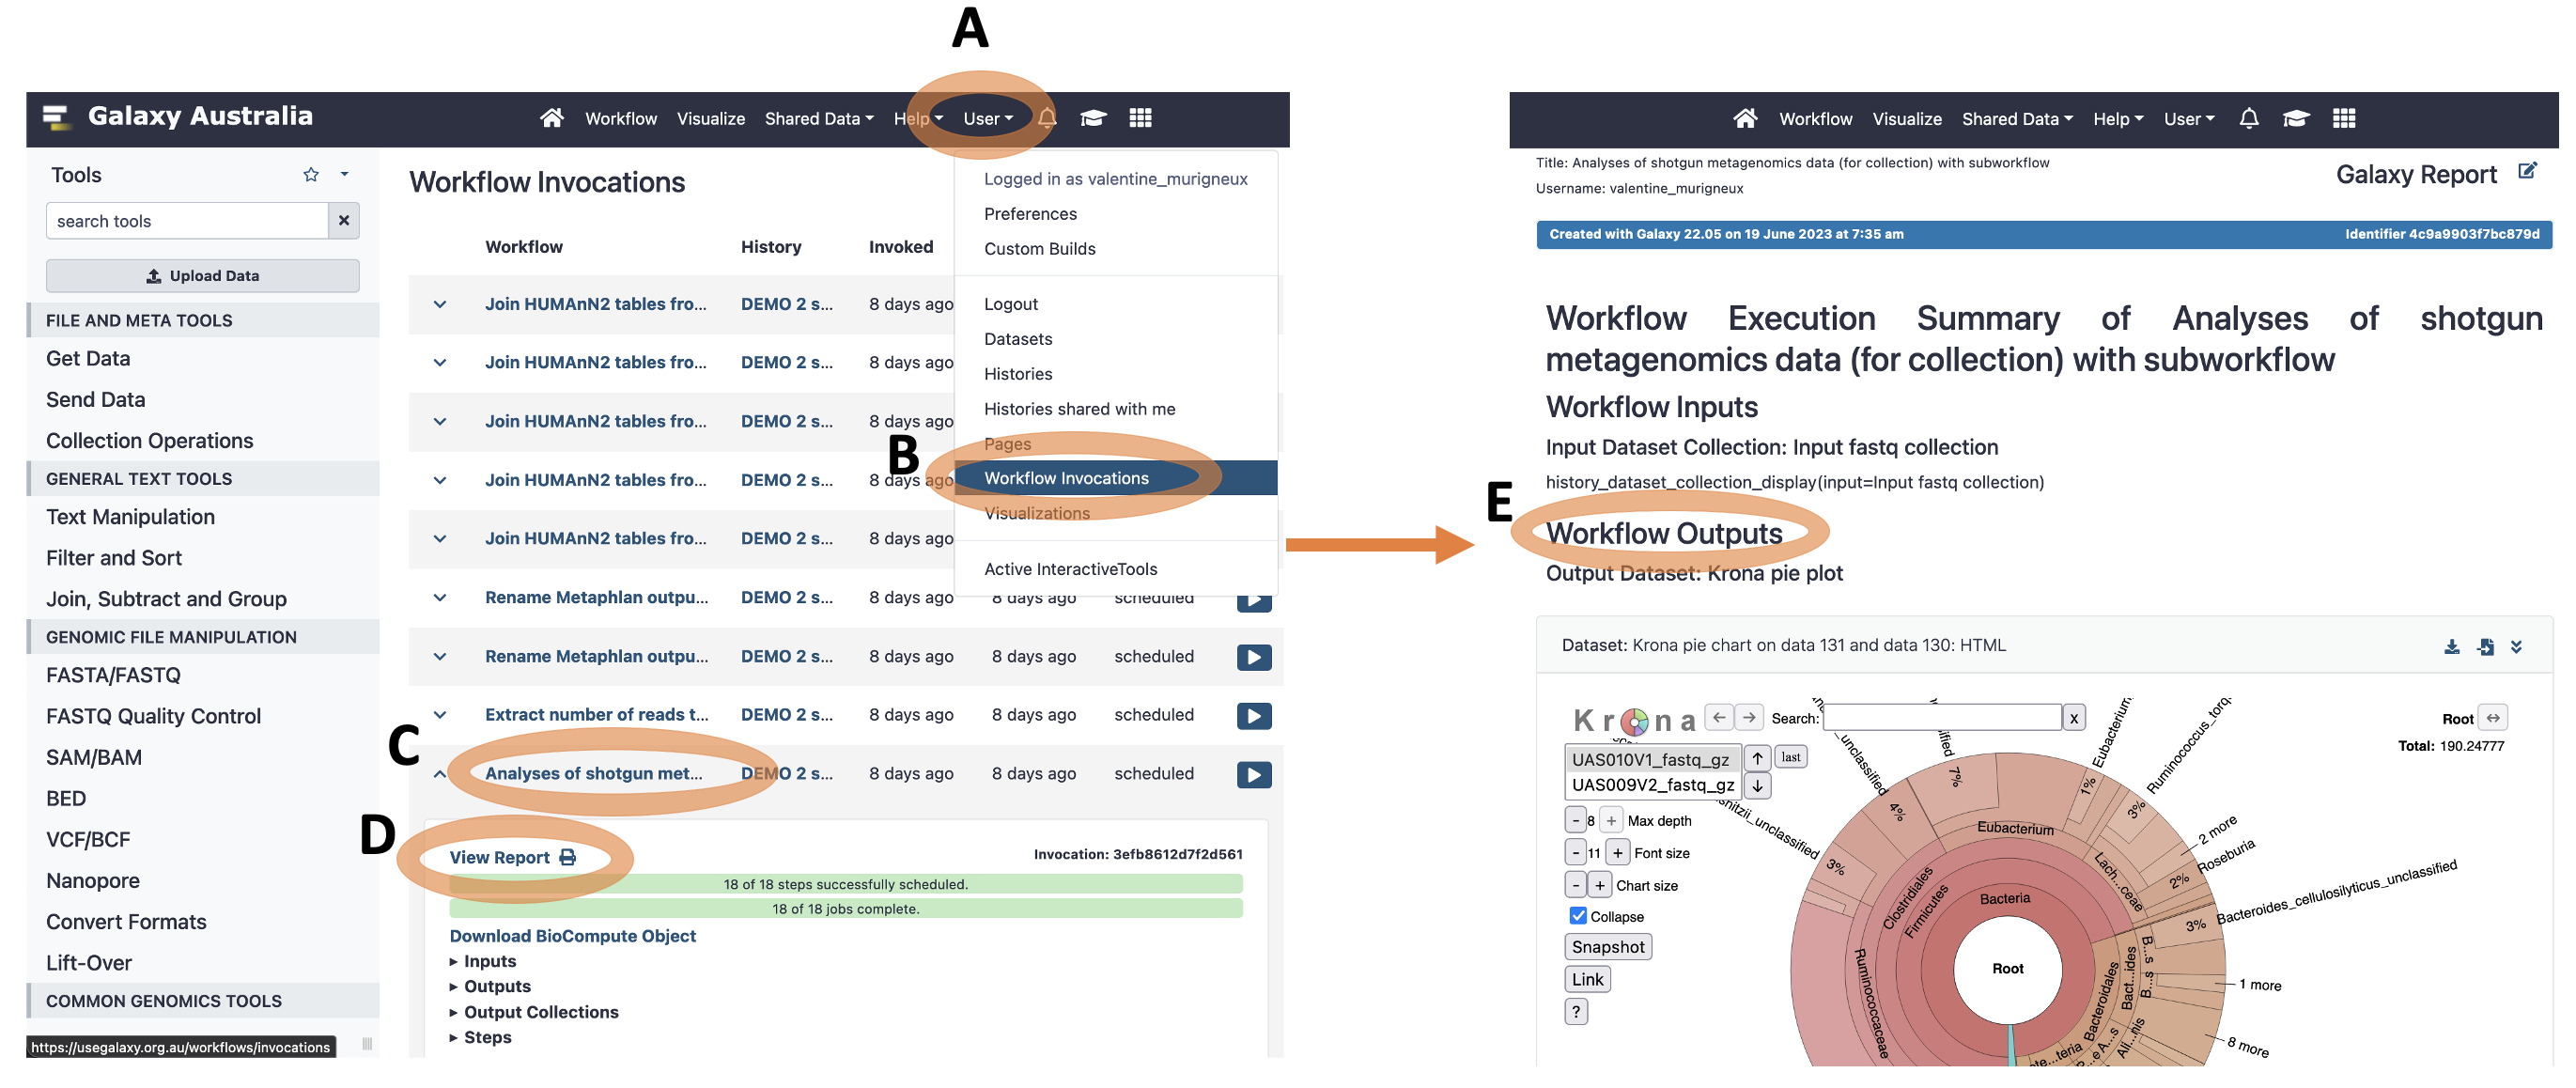
4. Once the workflow has completed, open the report
A report will be automatically generated for each invocation of the workflow. The report is located under the menu “User” -> “Workflow Invocations”.
A. Click on “User” in the Galaxy horizontal menu
B. Click on “Workflow Invocations”
C. Scroll down and click on the name of the workflow: “Analyses of shotgun metagenomics data (for collection) with subworkflow”.
D. Right Click “View Report” -> Open in a new tab
E. The main output files are located under the “Workflow Outputs” section.
- Output Dataset: Krona pie plot (MetaPhIAn2 taxonomy abundance)
- Output Dataset: Merged MetaPhIAn2 taxonomy abundance table with sample ID
- Output Dataset: HUMAnN2 merged gene families abundance
- Output Dataset: HUMAnN2 merged pathways coverage
- Output Dataset: HUMAnN2 merged and normalised pathways abundance
- Output Dataset: HUMAnN2 merged and normalised gene families abundance
- Output Dataset: HUMAnN2 regrouped, merged and normalised gene families abundance
You can download each output dataset by clicking on the icon “Download Dataset” on the top right corner.
The “Output Dataset Collections” items contain the output file for each sample separately ().
Figure: Workflow Report
Example output
When run in full, the workflow produces the following outputs:
- Output Dataset: Krona pie plot (MetaPhIAn2 taxonomy abundance)
- Output Dataset: Merged MetaPhIAn2 taxonomy abundance table with sample ID
- Output Dataset: Merged table for HUMAnN2 gene families abundance
- Output Dataset: Merged and normalised table for HUMAnN2 gene families abundance
- Output Dataset: Merged, regrouped and normalised table for HUMAnN2 gene families abundance
- Output Dataset: Merged table for HUMAnN2 Pathways and their abundance
- Output Dataset: Merged table for HUMAnN2 Pathways and their coverage
- Output Dataset Collection: MetaPhIAn2 SAM file (one file per sample)
- Output Dataset Collection: MetaPhIAn2 biom file (one file per sample)
This is an example of Galaxy history containing the results for 15 samples and the corresponding workflow report generated by Galaxy.
Licenses
Usage of this workflow is dependant on the (generally permissive) licences of the underlying tools and platforms; including;